
See changing production conditions across sourcing regions.
Sourcing teams rarely own the fields they depend on. AP Intelligence gives them field and portfolio visibility across supplier acreage and sourcing regions: what conditions look like now, how they compare with earlier in the season, and where a closer look may be warranted.
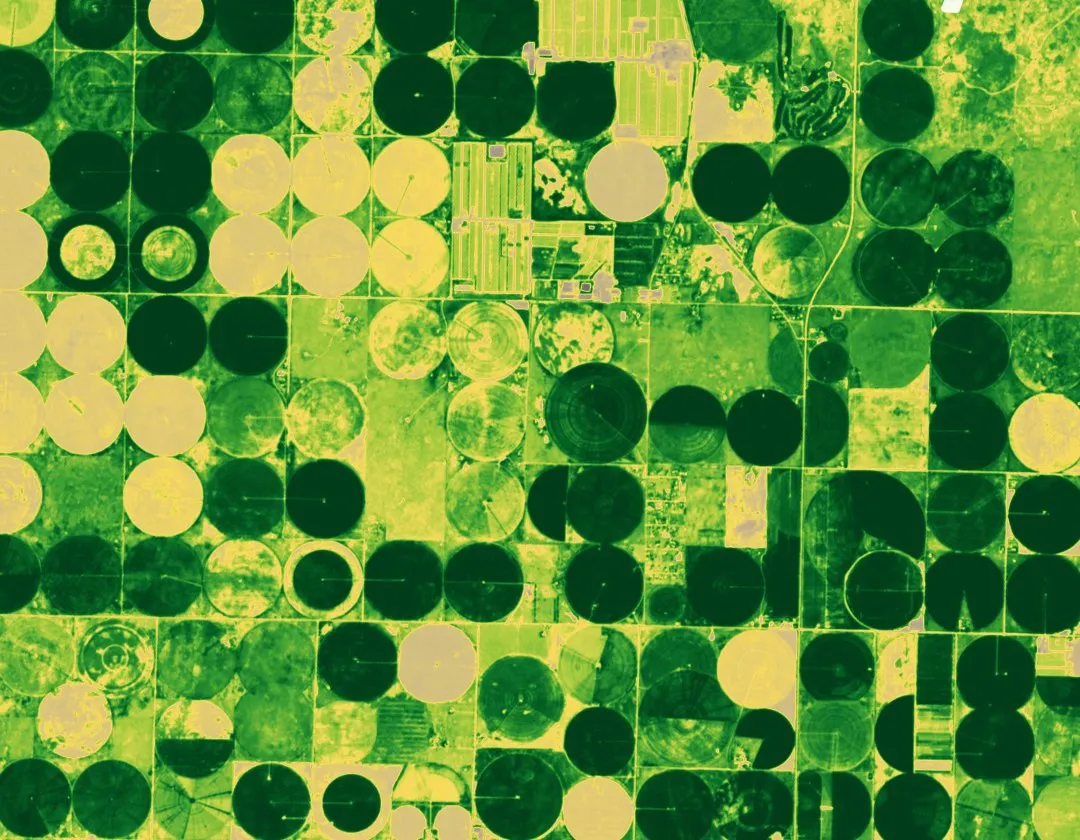
 AP Intelligence Region · Vegetation index Analysis frame
  AP Intelligence Season history Analysis frame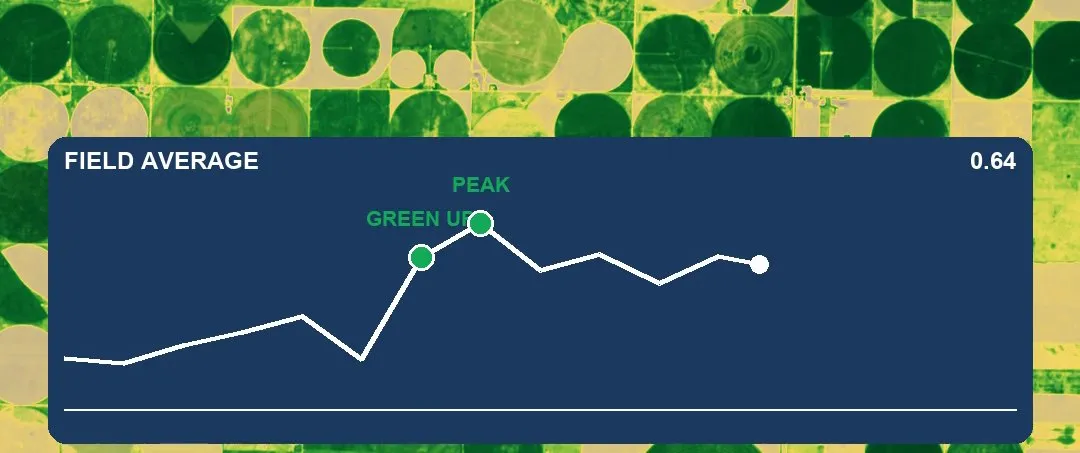
What sourcing teams monitor
Fields grouped by supplier, region, or program, so the sourcing team sees the acreage it depends on in one portfolio.
Satellite and weather context across a sourcing region, with Concern and Watch priorities where conditions changed.
Season history per field, so this year can be read against earlier in the season and prior seasons where history exists.
Portfolio-level reporting across regions and suppliers.
What AP Intelligence does not promise
AP Intelligence does not forecast procurement volumes, guarantee production, or replace supplier relationships. It shows field conditions and history across a sourcing program so teams can decide where to look and whom to call.
One portfolio across every sourcing region.
The Network Overview groups supplier fields by program and region, ranks where conditions changed, and keeps each field’s history in the same record the field team uses.
Program-specific dimensions such as contract status or delivery window are scoped per program and labeled in the product as they become available.
AP Intelligence Portfolio · Network Overview Season 2026 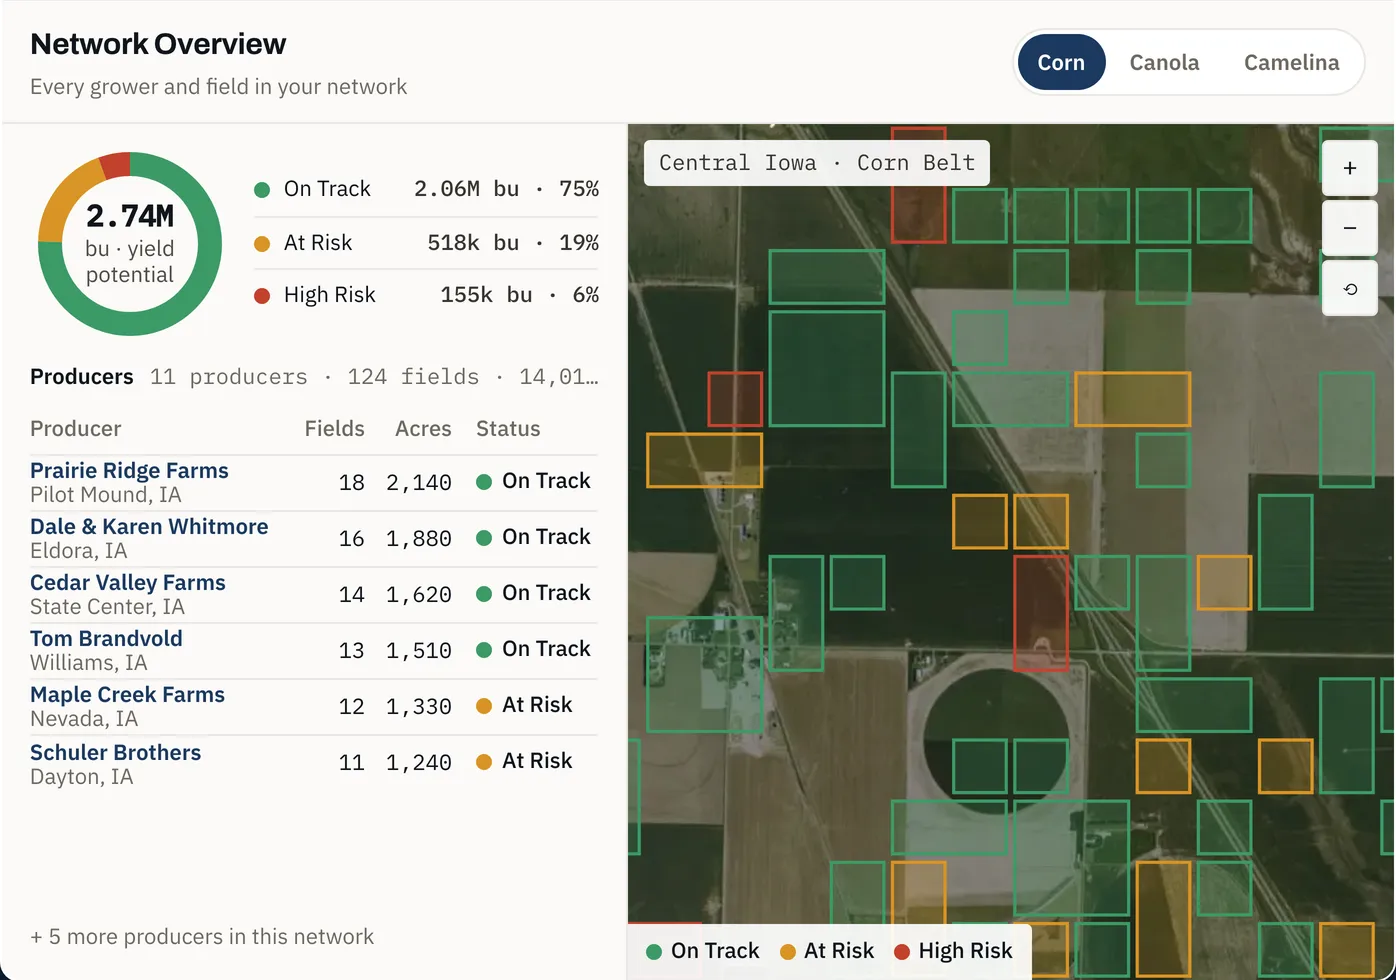
What determines pricing?
This use case is priced through AP Intelligence organization pricing (Basic, Pro, or Enterprise), configured to the program. There is no separate price list.
Regions, supplier acreage, historical depth, and reporting shape the configuration.
Organizational pricing depends on how the team works and the data configuration required.
See Organization Pricing- Portfolio scale
- Historical depth
- Spatial detail
- Monitoring requirements
- Users
- Reporting
- APIs
- System integration
- Data migration
- Specialized implementation
Plans are priced by fields, context, collaboration, and organization scale. There are no credits, usage meters, or industry-specific surcharges.
Start with one sourcing region.
Tell us what you source, where the supplier acreage is, and what your team needs to monitor through the season. We scope a program around a real region.
Discuss a Sourcing Program